Reporting, KPI and Metrics in Nora IPLM
Real-time visibility for every product decision

Data-driven insights for smarter product decisions.
Metrics KPIs
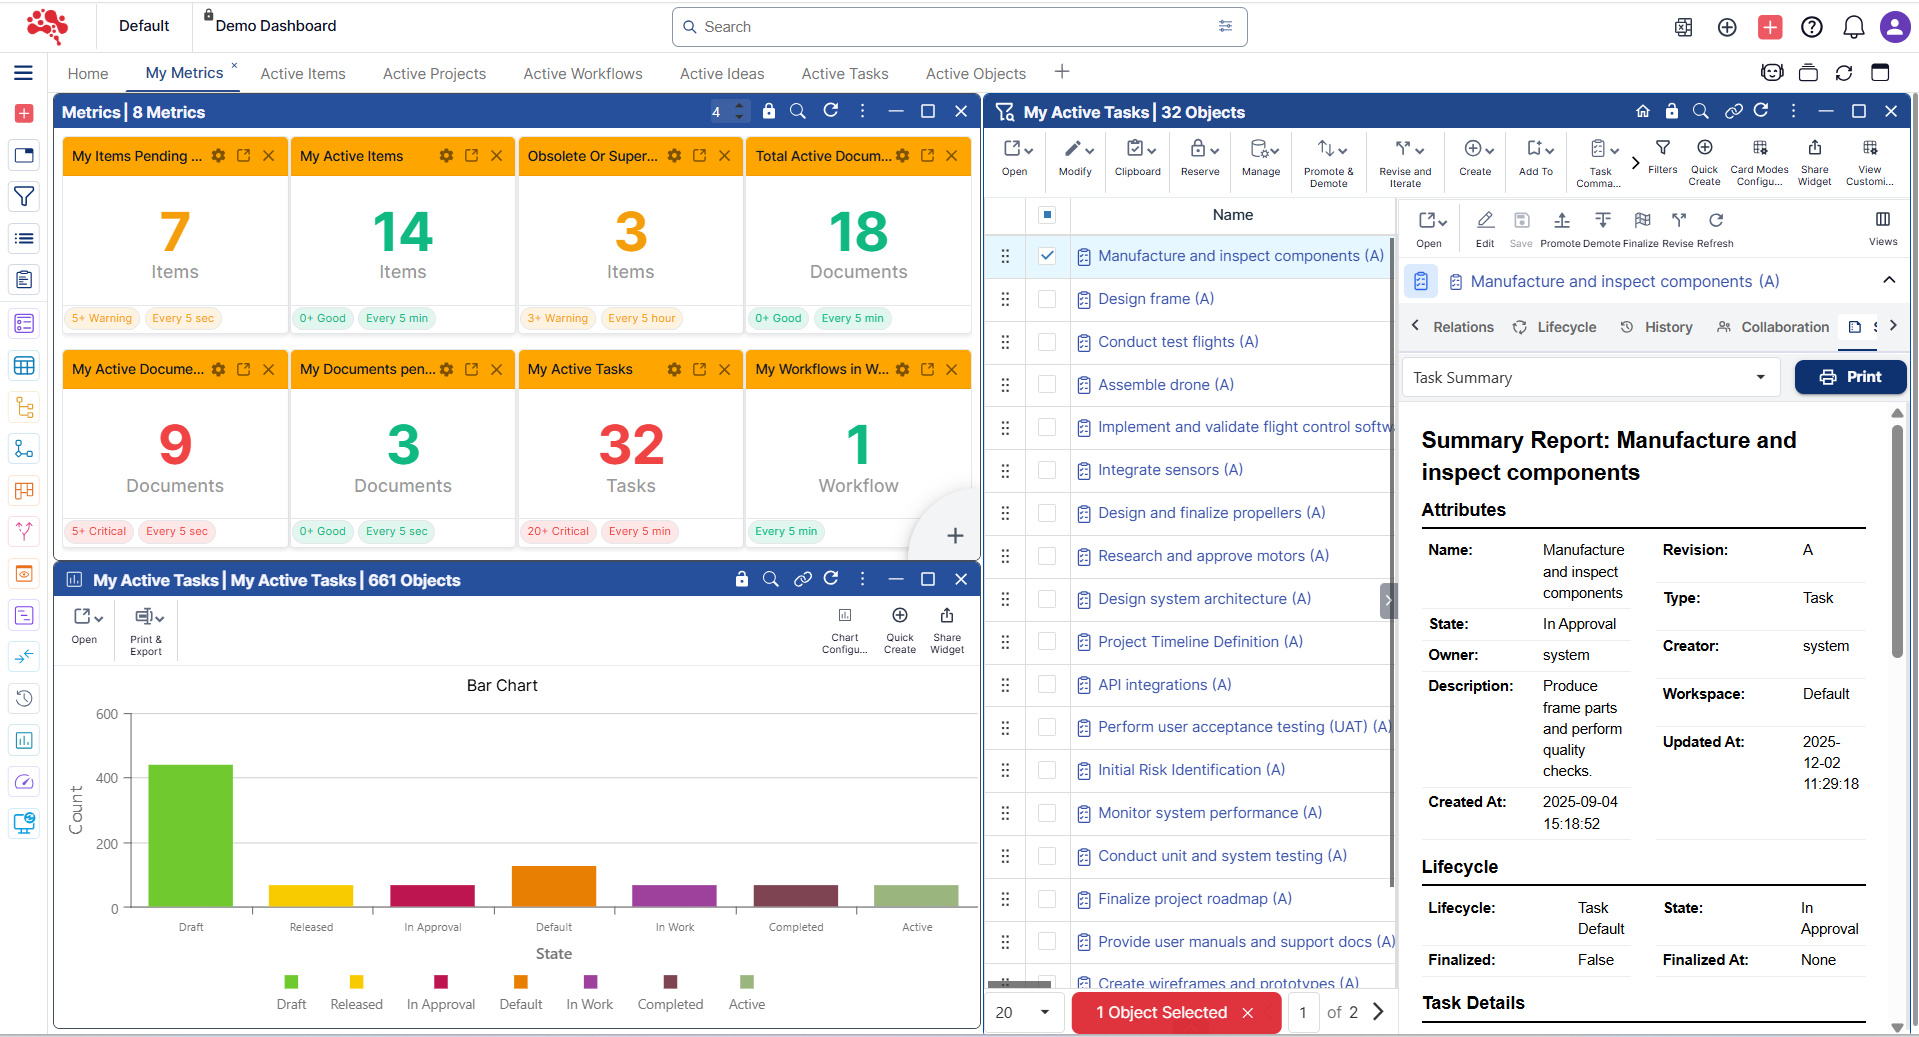
Nora IPLM’s Metrics & KPIs provide real-time visibility into product data, workflows, and engineering performance. Track key indicators across projects to identify trends, monitor progress, and support data-driven decisions. Customizable dashboards help teams measure efficiency, quality, and lifecycle performance with clarity.
Summary KPIs
Nora IPLM’s Summary Reports consolidate critical product and process information into clear, easy-to-understand views. Get high-level insights across projects, changes, and workflows without digging through detailed data. Designed for quick reviews, summary reports help stakeholders stay informed and aligned.
Analytics That Drive Better Decisions
One centralized hub to monitor performance, track progress, and turn product data into actionable insights.
Reporting
Generate structured, role-based reports across projects, items, changes, and workflows, always using real-time PLM data.
KPIs & Metrics
Track key performance indicators like cycle time, change velocity, and workload distribution to stay aligned with business goals.
Charts & Visuals
Visualize trends with interactive charts that make complex product data easy to interpret and faster to act on.
Real-time visibility for every product decision
Nora IPLM gives teams a unified reporting environment that converts PLM data into instant insights. Charts, metrics, KPIs, summary reports, print views, and Excel exports work together to provide clear, accurate and always up-to-date visibility across the entire lifecycle.
Instead of compiling data across modules, users generate charts, metrics and reports within seconds through an intuitive, configurable interface. Every widget can be filtered, exported, shared and printed with one click.
Reporting insights at a glance
Instant Charts, Metrics and Reporting
Create visual insights from any object, attribute or filter
Nora IPLM lets users generate charts and KPIs instantly across items, tasks, changes, documents, workflows and custom attributes. Every dashboard widget can pull from multiple data sources with dynamic or static filters and user-defined logic.
What you can do in seconds
Advanced Chart Creation
Fully configurable chart widgets built to explore any dataset
Turn turn PLM data into visual analysis with a click. Every chart is customizable and supports analytic workflows across engineering, operations, and product teams.
Charts in the platform are ideal for lifecycle status distribution, project performance, workload tracking, BOM change patterns, revision analytics and more.
What you can do in seconds
Export chart widgets to Excel and print chart visuals with built-in print support.
Chart capabilities at a glance
Real-time analytics
Multi-source data inputs
Fully configurable axes
Advanced grouping logic
Export and print ready
Discover the Chart Widget
Track trends, monitor performance, and analyze key metrics across the product lifecycle to make faster, data-driven decisions.

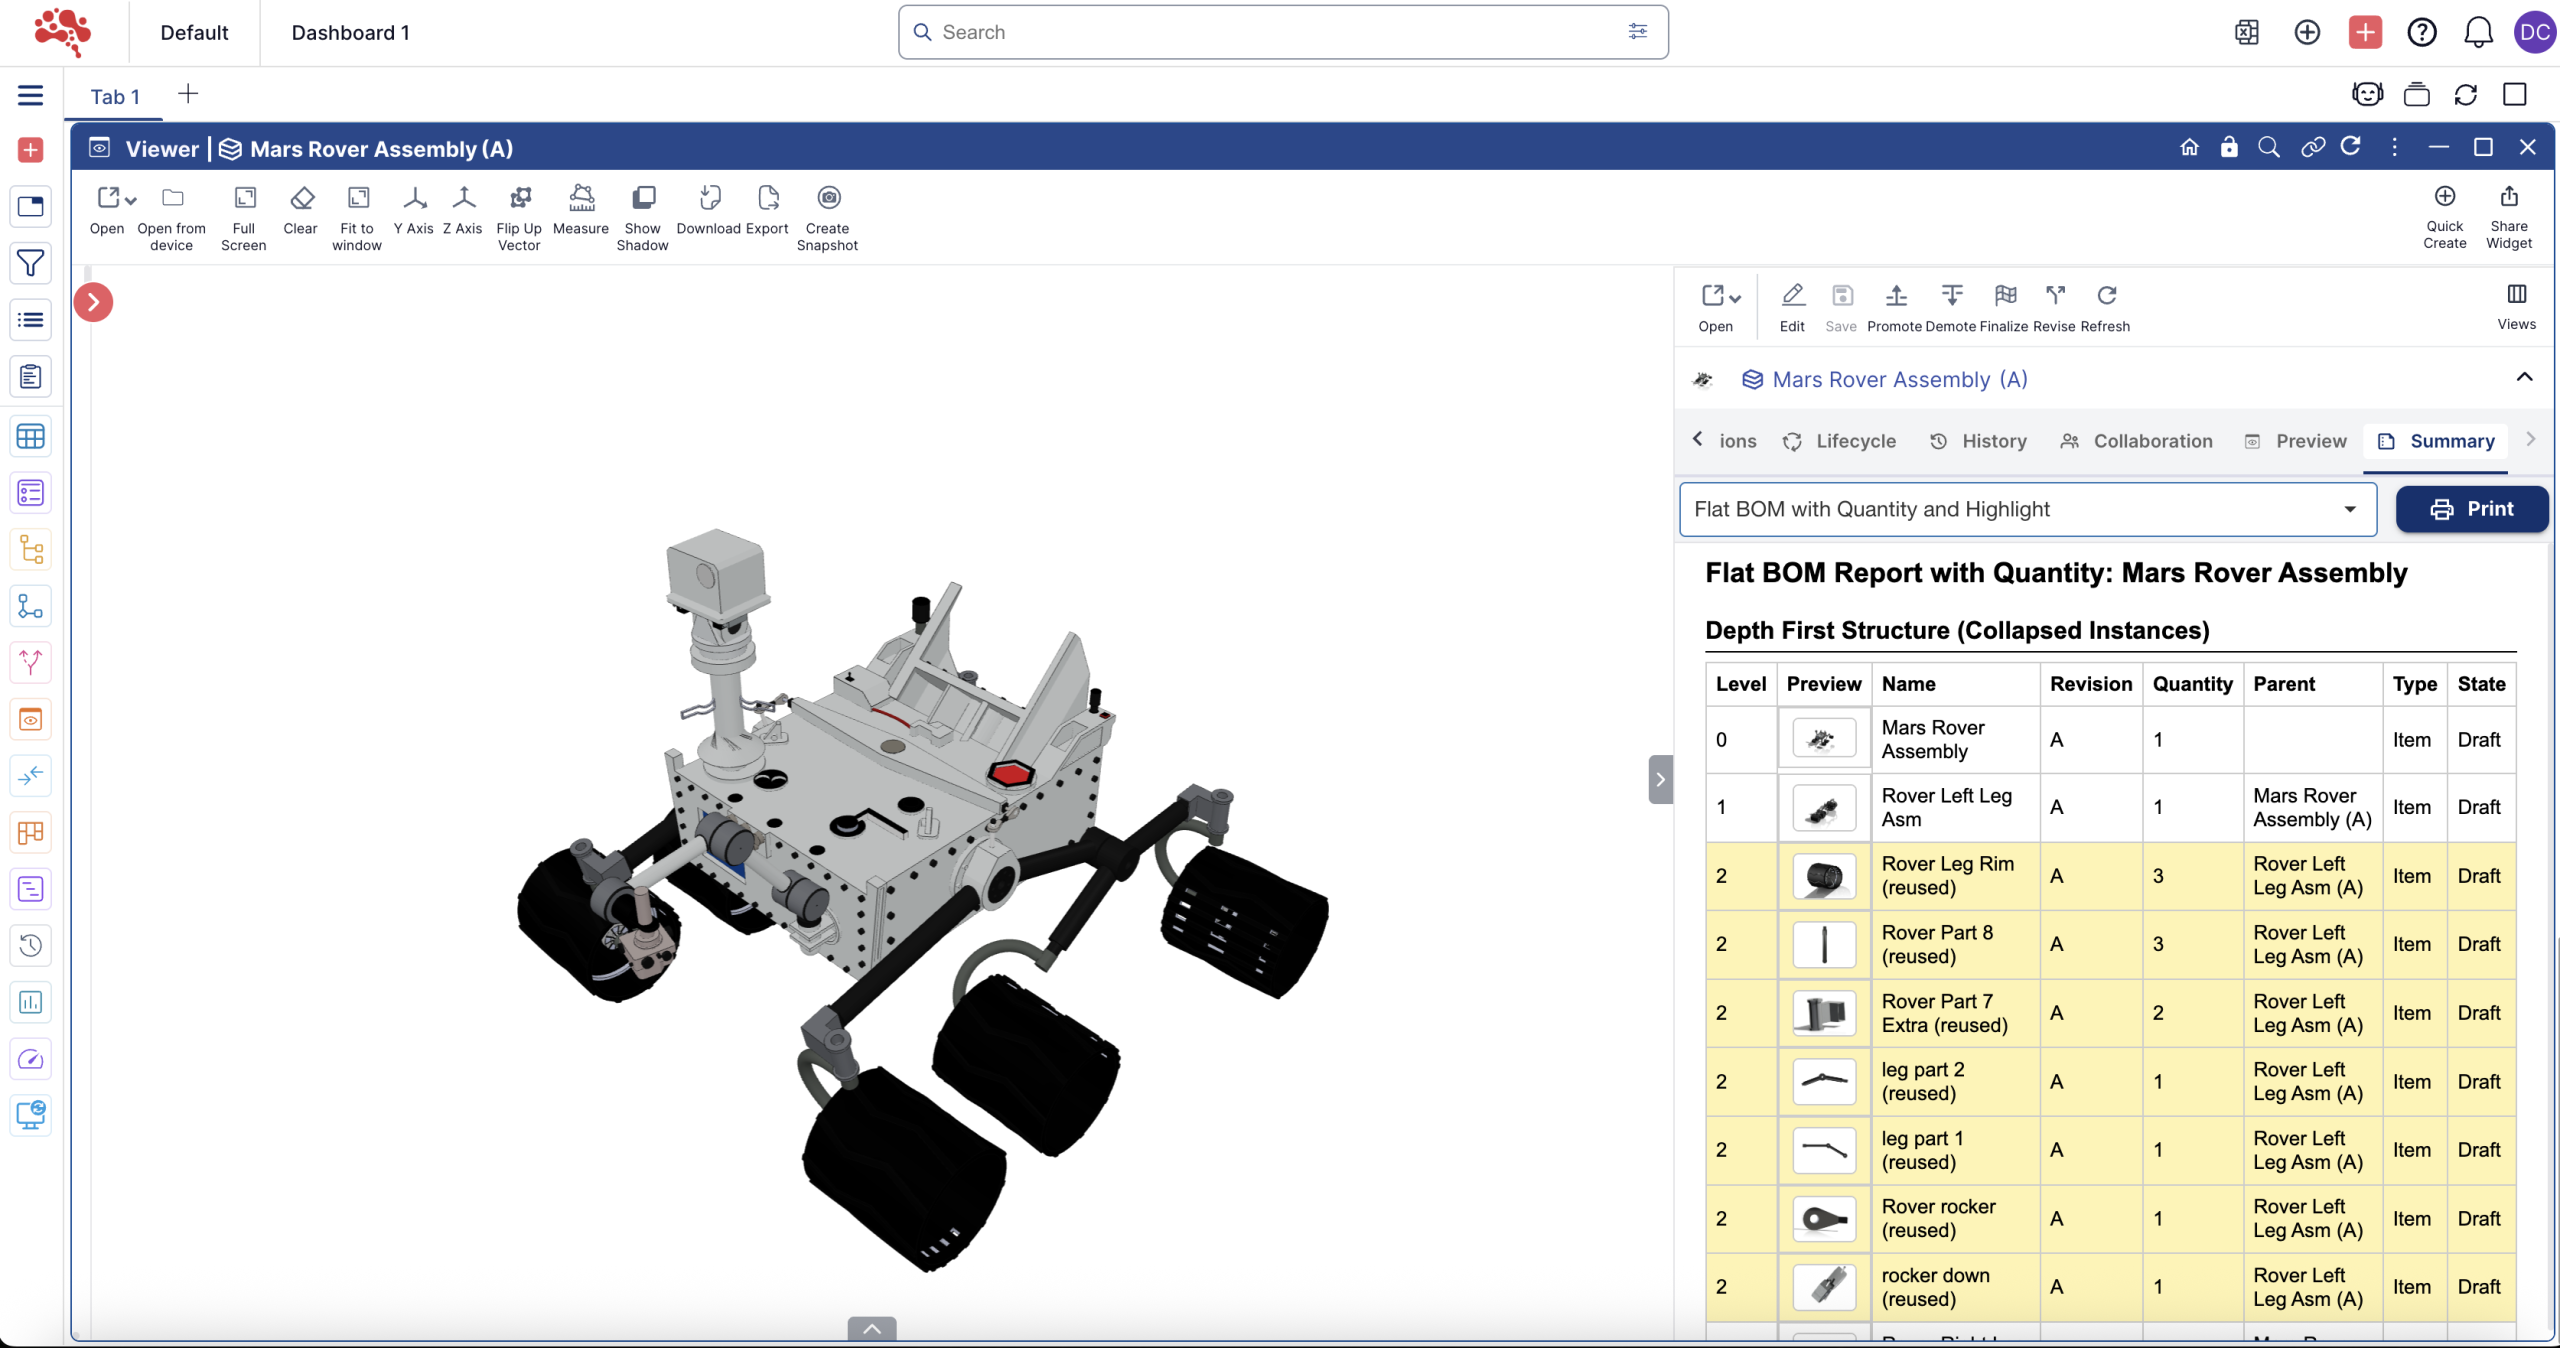
Summary Reports for Complete Object Visibility
One-click reporting for parts, assemblies, documents and changes.
Nora IPLM Summary Reports compile everything related to a single object or structure and export it instantly in Excel or PDF. These reports provide deep visibility without manual work.
Included insights
- Attributes
- Revisions
- Change history
- Workflows and approvals
- Children and parent structures
- Dependencies
- Usage
- Part list analysis
- Flat BOM analysis
- Project tracking insights
- Change evaluation details
- Task analysis
- Linked documents, tasks or changes
Best fit use cases: Part list analysis, flat BOM analysis, project tracking, change evaluation and workflow reviews.
All attributes, revisions, workflows, structures, tasks and linked changes combined into a single shareable report.
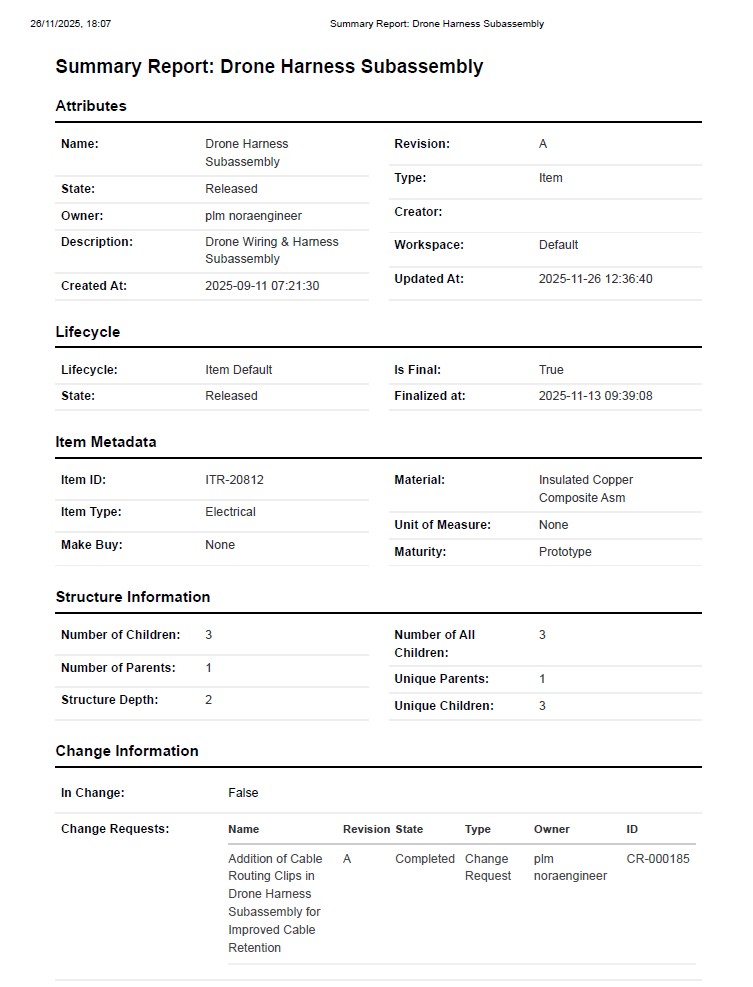
Instant Summary Reports for PLM Data: Your entire object story, generated in seconds
Turn hours of manual reporting into seconds with Nora IPLM Summary Reports. Every key insight is consolidated automatically, including BOMs, change histories, dependencies, workflows, revisions, usage, and structure. Download the entire dataset instantly in Excel or PDF.
Instant one-click report generation
Create complete reports instantly without manual compilation.
Complete visibility across product data
See attributes, structure, changes and dependencies in one view.
Effortless Excel & PDF export
Download full datasets instantly in shareable formats.
Audit-ready compliance tracking
Ensure traceability for approvals, revisions and workflows.
Zero learning curve with predefined templates
Start reporting immediately with structured templates.
Real-time updates with accurate insights
Reports stay synced with live PLM data.
Eliminates manual reporting effort
No spreadsheets, no copy-paste, no rework.
Built for engineering alignment
Designed for engineers, reviewers, and decision-makers.

Why Use Reporting, Metrics and KPIs in Nora IPLM
Nora IPLM provides a complete analytics environment designed for engineering accuracy and operational clarity.
You get
Why it matters
Dashboards for Every Role
Create and share personalized workspaces
Users can build dashboards using charts, metrics, tables, snapshots and summary reports. Dashboards can be saved, duplicated and shared (by admins) so teams stay aligned across operations, design and engineering.
Dashboard capabilities include
- Unlimited tabs and layouts for flexible workspaces.
- Mix charts, metrics, reports and objects into one view.
- Share dashboard views with team members.
- Real-time updates across all widgets.
- Personalized views based on user permissions.
- Perfect for daily reviews, engineering standups and cross-team alignment.
Dashboards become the operational home for your product lifecycle.
Dashboard highlights
Rethinking Digital Transformation with
De-Documentation and AI
Discover how De-Documentation and AI are reshaping digital transformation for faster, smarter collaboration.